It’s been another cold, wet couple of days, courtesy of another East Coast Low. It certainly feels like there have been a lot of East Coast Lows lately, but have there really?
How often do ECLs happen anyway?
As I’ve mentioned before, the question depends a bit on how you’re defining ECLs.
Taking the widely-used ECL database by Speer et al. (2009), there are about 7 ECLs per year that have widespread coastal rain, varying from just 3 in 2000 & 1980 to 14 in 1978 and 1988. In Sydney, of the four days a year with 50 mm of rain or more, about half of them are due to ECLs, including 6 ECL-related heavy rain days in 1998.
While on average one ECL a year causes widespread coastal flooding, about half the years between 1860 and 2014 had no ECL-related severe flooding, while there were 5 big ECL floods in 1879 and 1975.
The important ECLs also often come in clumps, when the conditions are right for several ECLs to happen in the space of a month or two. This happened in June 2007, April 2015 and June 2016, but is not a new phenomenon – in fact, 42% of significant ECLs occurred in a group of at least 3 ECLs over 2 months, including 56% of events in those main months of April-June.
How do recent years compare?
The first decade of the 2000s had slightly lower ECL frequencies using some definitions, but most studies find no real trends in ECL frequency over at least the last 60 years, while coastal floods have increased in frequency over the last century.
As a scientist it’s tricky to compare years when the data isn’t in yet – automated ECL methods generally rely on reanalysis data, which is currently only available until March this year. And the reanalyses aren’t perfect, especially with the small/complex ECLs that can still do a lot of damage – for example, the severe ECL from April last year wasn't very symmetrical, so doesn't show up very well in reanalysis data.
 21 April 2016 - BoM Chart | 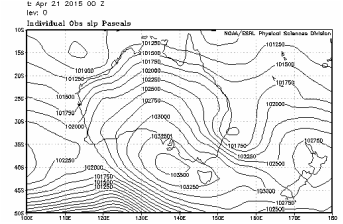 21 April 2016 - NCEP Reanalysis |
Looking through the Bureau’s archive of weather maps and reports, this year has so far seen at least 5 major ECLs – one in January, two in June, one in July, and now one in August. And, of course, many other lows that were smaller, or less impactful, or a bit further away from the coast. So far that seems about normal to me.
Perhaps the feeling that there are more ECLs than usual is just short-term memory and too much Sydney focus – yeah, we’ve had some big ECLs in 2015 and 2016, but in terms of history it’s really not that exceptional. Just in the last 30 years there have been 21 ECLs that caused at least 100mm of rain in a day in Sydney, including three in 1998 and a massive 328 mm in 1986, and there have been some much more severe ECLs in the past. But just one of these Sydney ECLs was in the seven years 2008-2014 and it was pretty shortlived, so it’s been a while.
There's a huge amount of year to year variability in ECLs, and there’s a lot we still don’t know about how much they've varied in the past. But to look at the last couple of years and think ECLs have increased in frequency is probably a tad precipitous.
 RSS Feed
