It's been a while since I wrote a blog, but it's always good to talk about new research. In the limbo stage between finishing my PhD and finding a job, one of my supervisors luckily had the funds to employ me as a research assistant for a few months, where I worked on this project. I started work on it at the end of January, so it's pretty cool that it's published online already!
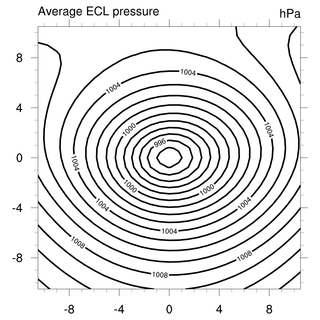 Example of what an average ECL looks like from reanalysis pressure data
 One of the things I've mentioned before is that there's no perfect database of past East Coast Lows, which would be a handy thing to have to look at things like trends, variability, or whether climate models do a good job. The main way we identify ECLs is by taking computer code that's good at identifying areas of low pressure, and applying it to some sort of gridded pressure data.
Since we can't get gridded pressure observations from satellites, what we use are called reanalyses. These are basically a weather forecast model that takes in all of the observations from around the world to make the best possible guess of what the atmosphere currently looks like.
Since we can't get gridded pressure observations from satellites, what we use are called reanalyses. These are basically a weather forecast model that takes in all of the observations from around the world to make the best possible guess of what the atmosphere currently looks like.
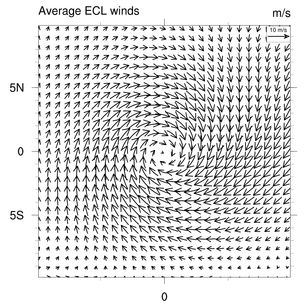 Average ECL wind pattern from satellite data
 There are about half a dozen of these reanalyses, and they all use different models. And the tricky thing is that if you smooth them all out to the same resolution - about 250 km between each grid point - they all kinda show the same results when you look for ECLs using your algorithm. But when you use grids that are more like 50 km instead, some reanalyses seem to have more than double the number of cyclones that others do!
So this paper is an attempt to see which reanalysis is actually the most correct, using satellite data. Because while we don't have global observations of pressure, we do have satellite observations of rainfall and winds. And we know that a "cyclone" should have "cyclonic" winds - which in the southern hemisphere basically means clockwise, spiraling into that central low point. So we took the satellite winds for a database of "known" ECLs to find some parameters that an ECL should have, and then looked at what the satellite winds showed for a whole bunch of reanalyses.
What we found was that there was a really simple metric we could use to check if an identified ECL was a "real" cyclone with cyclonic winds, and using this made the reanalyses a lot more similar. The one reanalysis that had too many ECLs, had a lot of systems which weren't really cyclones, and looked a lot more like a cold front. Conveniently, the "best" reanalysis for ECLs was the European one, which is already the most popular for ECL studies. This helps us get a better handle on which dataset to use for evaluating climate models.
 RSS Feed
