Last month, a severe extratropical cyclone hit southeast Australia, which is being called a 1-in-50 years event. The storm caused severe winds, heavy rainfall, and major damage, including a blackout that affected the whole state of South Australia.
So, how do we know it was a 1-in-50 year storm, and how can we tell how strong a cyclone is in general? Tropical cyclones have a cyclone intensity scale we talk about, and people have some idea of the difference between a category 1, 3 or 5 cyclone. This is based on the strongest winds around the cyclone centre, which isn’t always a perfect indicator of how large its impacts are.
But what about extratropical cyclones, like the one that hit Adelaide, or the East Coast Lows that I study? They can be a bit harder to pin down.
1. Central pressure
One of the easiest ways to think about how strong a cyclone is is the pressure in the middle of a cyclone, with deeper cyclones being stronger. During the Adelaide cyclone, Bureau mean sea level pressure charts gave it a minimum central pressure of 973.3 hPa, which sounds pretty low.
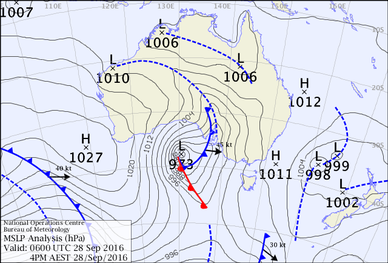
Mean Sea Level Pressure chart for 1600EST on 28 September 2016. All pressure charts are from the Australian Bureau of Meteorology
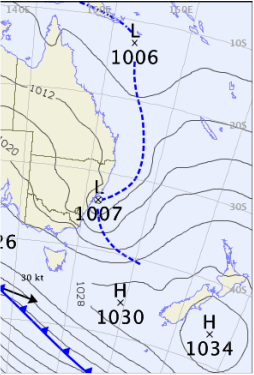 MSLP chart for 1600 EST 22 April 2015
 Of course, we don’t have good databases of cyclones in southern Australia to compare this easily to past events, so we have to make one. To do that, I ran the same cyclone tracking method I use for ECLs, but changed the region I was looking at to cover the Adelaide region - 25-45°S, 125-145°E. I ran this on gridded pressure data from the NCEP1 reanalysis, which allows us to look at cyclones back to 1948, although it’s important to note there might be some issues in the pressure data, especially before satellites came in in 1979.
Because the reanalysis only has pressure data every 250 km, the central pressure of the cyclone wasn’t as strong - 977.7 hPa. But this was the deepest cyclone in the analysis north of 37.5°S, which ties in pretty well to the 1-in-50 years claim. Deeper cyclones are more likely to be further south - some cyclones around Antarctica in my dataset had pressures down to 930 hPa!
2. Pressure gradients
The problem with using the central pressure of the cyclone is that pressure tends to get lower as you move south. This means that central pressure really isn’t a good indicator of how bad a cyclone’s impacts are, especially for East Coast Lows. The complex ECL that caused a lot of damage in June this year had a central pressure of 990 hPa; the severe ECL from April 2015 only got down to 1007 hPa.
So a more common way scientists will look at cyclone intensity is by looking at how strong the gradient of pressure is, which is a better indicator of how strong the winds will be. This can be measured in a number of ways, including by looking at the average difference in the pressure between the cyclone centre and the pressure 200km or 500km away, or by calculating metrics like the “Laplacian” of pressure (which is what my method uses).
Using this method, I get a Laplacian for the Adelaide cyclone of 3.5, which is way higher than the previous record for this far north in the Adelaide area of 2.9. This is also stronger than any of the ECLs in my database, although there have been a few with intensities stronger than 3, most recently in June 1998.
Of course, this is usually calculated as an average around the cyclone - ECLs often have much stronger gradients to the south of the cyclone than the north, so you may want to only calculate the maximum pressure gradient of the storm, or the gradient on the south side, to really get at those big events. And low-resolution pressure fields like in the NCEP reanalysis really can’t capture the smaller “mesolows” that cause locally severe impacts inside the bigger system. So the Laplacian for the April 2015 ECL is only 1.4, and the infamous Pasha Bulker storm is only 1.6.
3. Impacts
What people really care about with cyclones are the impacts - how strong was the wind, how much rain fell, how big were the waves? This can be influenced by a number of things beyond the cyclone itself, like how high the astronomical tides are or how warm/moist the atmosphere is (both important for the ECL in June 2016). It can also depend on other things like how big the cyclone is, how close it is to populated areas, or how long it stays in one place. These are even harder to quantify, although there is a good analysis looking at severe ECLs in terms of their coastal flooding.
Because the storm in September was that bit further north, it was in just the right place to have major impacts, with very strong winds and many September rainfall records. A few degrees further south, and you have the cyclones that passed through on 10 July and 18 August this year - South Australia still received strong winds and rain from the cold fronts attached, but the impacts were much smaller.
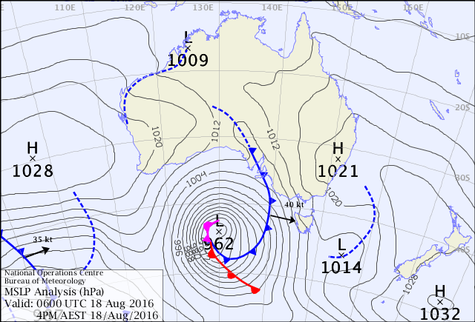
MSLP chart for 1600EST on 18 August 2016
So really, whatever way you look at it, the cyclone in South Australia last month looks like the strongest in the area for at least 60 years. But it’s not always as simple, especially when dealing with ECLs.
 RSS Feed
