Every time an East Coast Low hits, people ask whether they are getting more frequent. But this is a hard question to answer, as there is relatively little pressure data available before the 1950s, making it hard to identify long-term changes in frequencies. So far, limited studies suggest southeast Australia may have become less stormy compared to the 19th century and earlier periods:
All of these studies looked at slightly different things, so results can't necessarily be applied to East Coast Lows as I've been defining them. But the lack of station data before 1950 means that the maps of pressure we use to find ECLs (mostly from products called reanalyses) don't start until the 1950s or even 1979 (when satellite data is available). So, what can we do?
Last year, we had a student from the US visiting us during the winter, and we decided to look at whether we could say anything about ECLs using the 20th Century Reanalysis, which goes back to the late 1800s. What makes this reanalysis special is that instead of having just one version, they ran it 56 times with different initial conditions, just like we would do for modern seasonal prediction - we call this an ensemble. This means we can get a more robust look at different ways the climate might have been during the past, when our observations were less useful.
We found that, prior to around 1960, the different ensemble members did different things, so if you used the average pressure field you found very few ECLs at all. But, if you look at ECLs in each of the members individually, there was a lot of agreement on how many ECLs occurred each year, at least back to about 1910, beyond which things start to get a bit sketchier. We also found the ensemble members did a surprisingly good job of detecting the really big and impactful ECLs during the late 1800s, which made us confident they were identifying “real” cyclones.
- Paleoclimate data suggests that the climate of eastern Australia was much stormier during the 1600s to 1900s than now
- Station pressure data shows storminess in southeast Australia has decreased since the late 19th century
- Newspapers and other records suggest severe coastal floods have increased since the 1860s
All of these studies looked at slightly different things, so results can't necessarily be applied to East Coast Lows as I've been defining them. But the lack of station data before 1950 means that the maps of pressure we use to find ECLs (mostly from products called reanalyses) don't start until the 1950s or even 1979 (when satellite data is available). So, what can we do?
Last year, we had a student from the US visiting us during the winter, and we decided to look at whether we could say anything about ECLs using the 20th Century Reanalysis, which goes back to the late 1800s. What makes this reanalysis special is that instead of having just one version, they ran it 56 times with different initial conditions, just like we would do for modern seasonal prediction - we call this an ensemble. This means we can get a more robust look at different ways the climate might have been during the past, when our observations were less useful.
We found that, prior to around 1960, the different ensemble members did different things, so if you used the average pressure field you found very few ECLs at all. But, if you look at ECLs in each of the members individually, there was a lot of agreement on how many ECLs occurred each year, at least back to about 1910, beyond which things start to get a bit sketchier. We also found the ensemble members did a surprisingly good job of detecting the really big and impactful ECLs during the late 1800s, which made us confident they were identifying “real” cyclones.
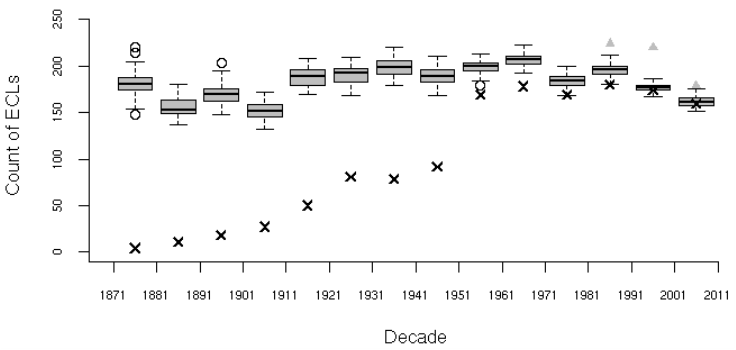
Boxplots show the numbers of ECLs per decade across all the 56 20CR ensemble members, and crosses indicate the frequency in the 20CR ensemble mean. In the later decades, triangles indicate frequencies in ERAI, one of the best of the "modern" reanalyses
This helped us extend our records of ECL frequency back to at least 1910, from which we can say:
Want to find out more? Read the paper!
- There has been no significant long-term trend in ECL frequency in the last 100 years;
- But the decade 2000-2009 had the lowest frequency of ECLs in at least the last century
Want to find out more? Read the paper!
 RSS Feed
